How it works

Select the drawing from Gallery.
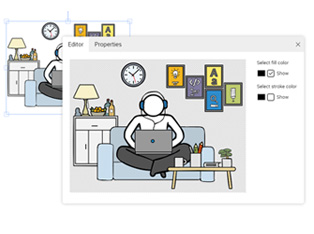
Double click on the image to open the editor window.
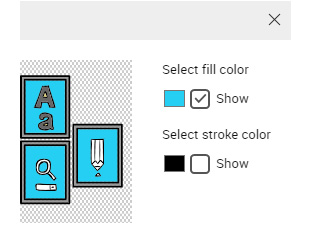
Select the brand color to fill up the image.
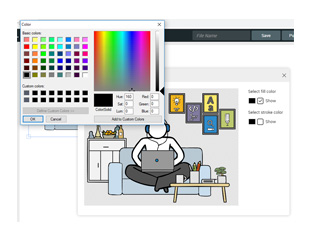
You can fill in a new color.
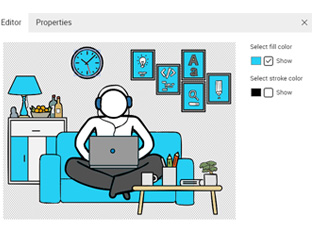
Fill in as many colors as in as many areas.

Change the background color to make the image more creative.
Example 1

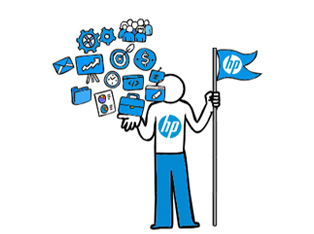
This is an original Pictofigo image/s.

The colors of the image/s can be changed as per your requiremetns.

This is a model example of how you can change a common graphic/s to a complete vibrant setting as per your needs.
Example 2

Upload image and add drawing.

Edit the color/s to synthesize with your brand.

Add icons, drawing/s and text.
Example 3

Original Drawing.

Branding and color changes.
Made personalized.


 Edit Image